Designx23 is a design production software program created for Jer Thorp’s Data Representation class to automate the production process of charts and graphs for the graphic design industry. For the last 3 years I have been designing and producing huge 400+ paged data and statistics books, each book contained about 4 main chart styles and each style has between 50-150 different data sets attached to it. In the past I created all 250+ charts manually using Adobe Illustrator which took between 4 to 8 weeks to complete, needed multiple people producing, checking and editing them, and ultimately because it took so long and required so many people the production cost for the client was insanely high. I have been trying to find a better, more automated solution to this but have been unsuccessful in my search for the “holy grail” of custom chart production. So rather than wait for a solution I decided to make my own.


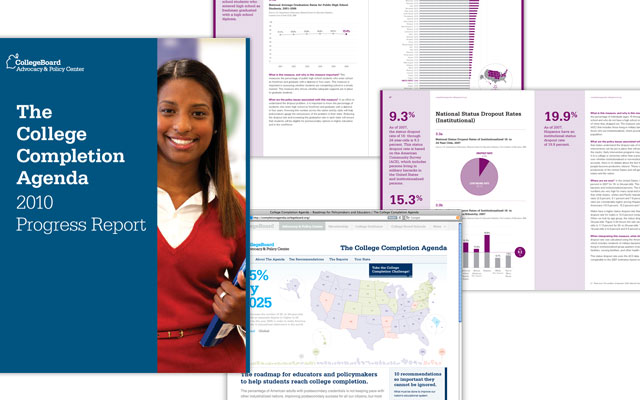
I decided to focus on the most challenging chart style that I designed in the past first, a state level chart for the College Boards College Completion Agenda. This bar chart included data for all 50 states (as well as DC), state name and percentage, the United States average, a map showing the states that are above and below the US average, chart ID number, chart title, chart source, and section color. I redesigned the chart in code using Processing thus making the entire thing dynamic and updatable. There is a CSV spread sheet attached to it containing the state name, percentage, average, ID, title, source, section color, etc. When a new CSV gets uploaded all the content changes to reflect the new data. I also included a GUI interface for minor design edits, i.e. height, width, location, line weight, etc. Once you have something that you like the user hits “shift P” to print a vector editable PDF which can be placed into a InDesign document or edited in Illustrator. This program will in the end cut the production time down from 4-8 weeks to just a few hours, it is more accurate and much cheaper.


The software is very much in a beta version right now and ideally I would like the program to be able to upload SVG designs and translate those into dynamic updatable templates, right now I have to hand code the designs which is a little time consuming but still much faster and cheaper. I would also like to be able to output a print and web version, have more ability to adjust the design, do batch PDF creation, and much more. It would also be great to have this online for anyone to use and for people to share templates with the rest of the data visualization community.
Code: design23
